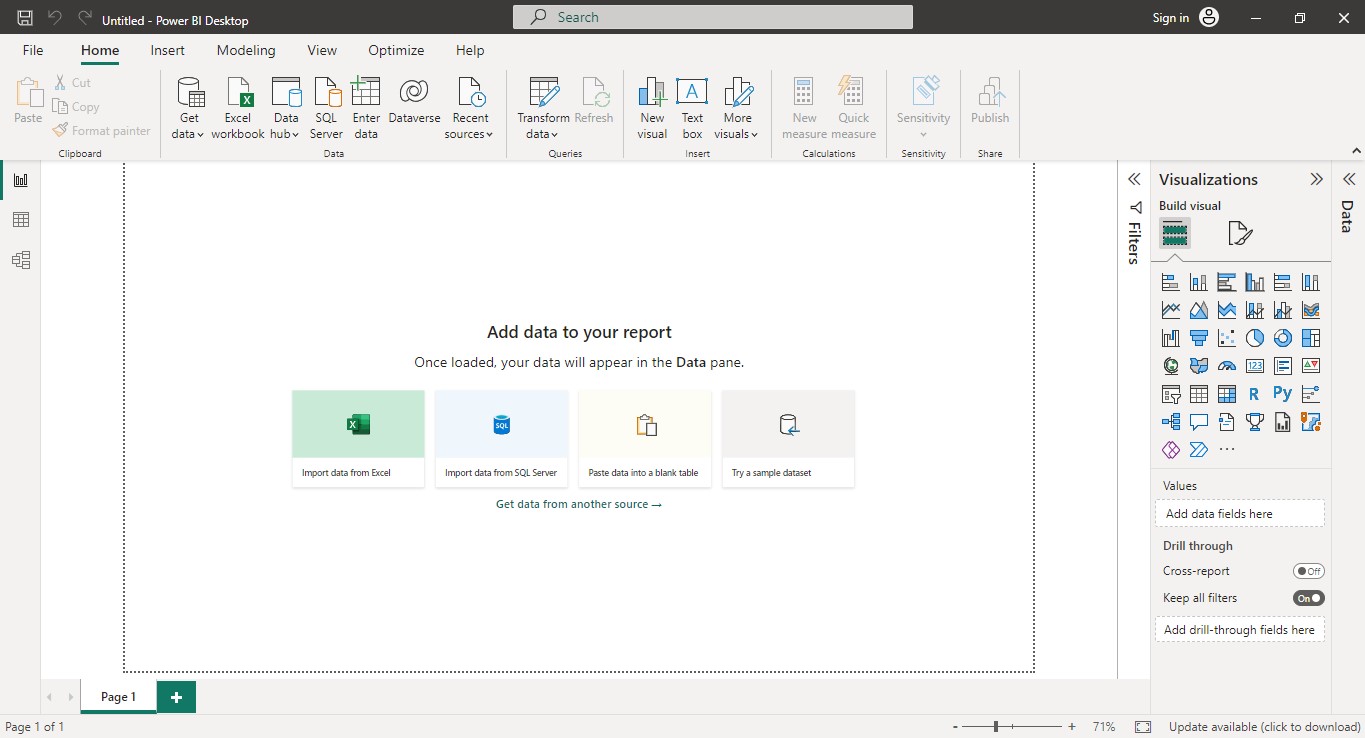
What is Power BI Desktop? Power BI Desktop is a powerful business intelligence tool developed by Microsoft. It is part of the Power BI suite, which includes other components like Power BI Service (cloud-based service) and Power BI Mobile (mobile app). Power BI Desktop allows users to create interactive visualizations, reports, and dashboards from various data sources.
With Power BI Desktop, you can connect to a wide range of data sources such as databases, Excel files, CSV files, SharePoint lists, cloud services, and more. It provides a user-friendly interface for data transformation and modeling, allowing you to shape and clean your data before analysis. You can apply various transformations, such as filtering, merging, appending, and creating calculated columns.
Power BI Desktop offers a rich set of visual elements like charts, tables, maps, matrices, and gauges. These visuals can be customized and formatted to suit your needs. You can also create interactive reports with slicers, filters, and drill-through capabilities, enabling users to explore data and gain insights. Once you have connected to your data and transformed it, you can create compelling visualizations using a drag-and-drop interface.
Power BI Desktop supports the creation of advanced calculations and measures using a formula language called DAX (Data Analysis Expressions). DAX allows you to define complex calculations based on your data model, enabling calculations such as aggregations, time intelligence, and custom calculations. Additionally, Power BI Desktop provides the ability to create relationships between different data tables, enabling cross-filtering and data synchronization across visuals. This allows you to build comprehensive dashboards with interactive elements that provide a holistic view of your data.
The flow of work in Power BI
Once you have created your report or dashboard in Power BI Desktop, you can publish it to the Power BI Service, where you can share it with others, collaborate, and schedule data refreshes. The Power BI Service also provides additional features like data alerts, natural language queries, and the ability to embed reports and dashboards in other applications.
A common flow of work in Power BI begins in Power BI Desktop, where a report is created. That report is then published to the Power BI service and then shared so users of Power BI Mobile apps can consume the information.In summary, Power BI Desktop is a comprehensive and versatile tool for data analysis and visualization. It empowers users to connect to various data sources, transform and model data, create interactive reports and dashboards, and share insights with others.


No comments:
Post a Comment